
Aging infrastructure maintenance costs: what is actually breaking your equipment and your budget
Just a 24-minute read
Equipment doesn’t fail randomly. It degrades along predictable curves — but deferred maintenance, poor lubrication practices, thermal cycling fatigue, and absent condition monitoring accelerate that curve dramatically.
Most facilities are spending 3–5× more on reactive repairs than they would with structured preventive programs. Here’s why.
Table of contents
1. The real mechanics of early equipment failure
2. How deferred maintenance compounds into structural cost
3. MTBF erosion: recognising the degradation curve before it costs you
4. Frequently asked questions about aging equipment and maintenance costs
Conclusion: Stopping the bleed, structured asset management as the practical answer
Introduction
Industrial assets don’t announce when they’re about to fail — at least not loudly. The signals are there: elevated vibration signatures, rising operating temperatures, increased energy draw, micro-leaks that maintenance crews patch and move on. What those signals are actually saying is that the asset has entered accelerated degradation. And once that phase begins, the cost-per-operating-hour climbs in ways that rarely show up clearly on a maintenance budget until it’s too late.
The uncomfortable reality is that most aging equipment failure isn’t caused by age alone. It’s caused by the accumulation of deferred maintenance decisions, inadequate condition monitoring, and the absence of a structured asset management framework that tracks degradation trajectories over time. A 20-year-old piece of equipment maintained with discipline will consistently outlast a 10-year-old machine that’s been run reactively. The difference isn’t the asset — it’s the system behind it.
1. The real mechanics of early equipment failure
Most maintenance managers intuitively know their aging assets are a problem. What’s harder to articulate — especially when justifying budget to finance — is precisely why they’re failing sooner than their design life should allow. The answer sits in a convergence of technical factors that compound over time.
Metallurgical fatigue accumulation is the baseline. Every stress cycle — thermal, mechanical, or vibratory — adds to the cumulative fatigue load on structural components. Design life calculations assume nominal operating conditions. When equipment runs hot, vibrates beyond spec, or cycles more frequently than designed, the fatigue budget depletes faster. For rotating equipment, this relationship follows a power law: doubling the load doesn’t double the fatigue damage — it multiplies it by a factor of 6 to 10, depending on material class.
Lubricant degradation is consistently underestimated. Oxidation, contamination by particulates, and thermal breakdown reduce viscosity index and diminish the protective film between bearing surfaces. Once metal-to-metal contact begins — even microscopically — surface wear accelerates in a self-reinforcing cycle. Oil analysis programs that check for particle count, viscosity, and additive depletion every 500–1,000 operating hours catch this before it becomes a bearing replacement. Most facilities running reactive programs don’t catch it until they hear it.
Insulation resistance decay in electrical assets is another slow-moving failure mechanism. Motor windings degrade through moisture ingress, thermal cycling, and partial discharge events that erode insulation integrity over years. Megohm resistance testing (Megger tests) on a 6–12 month schedule will trend the degradation curve and predict failure windows with reasonable accuracy. Without that data, the first indication is often a failed motor mid-shift.
Corrosion under insulation (CUI) is particularly problematic in process industries. Piping and vessels insulated for thermal management are invisible to routine visual inspection. Moisture trapped between the pipe wall and insulation initiates corrosion that can reduce wall thickness by 40–60% before it’s detected externally. Non-destructive testing (NDT) using pulsed eddy current or guided wave ultrasonics can screen large sections of insulated pipework efficiently — but it requires a program, not a one-time scan.
The compounding effect of these mechanisms is what makes aging infrastructure genuinely expensive. Each failure mode in isolation is manageable. When three or four converge simultaneously on an asset that hasn’t had a proper condition assessment in two years, the result is unplanned downtime, emergency procurement, and maintenance labour at premium rates — all happening at once.
Reference: According to a study by the Plant Engineering magazine (plantengineering.com), 82% of industrial equipment failures are random in nature — meaning they are not age-related on their own but are triggered by operational and maintenance conditions. This reinforces the argument that how you maintain matters more than how old the asset is.
ManWinWin Software is the result of 40+ years of experience and know-how

With thousands of users in 120+ countries in the World. Created by Portuguese Engineers has been improved with implementations, and listening to thousands of clients worldwide using the system.
Get a personalized demo of ManWinWin CMMS
Please fill out the form and wait for one of our specialists to contact you to schedule a date at your convenience.
- Discover how ManWinWin solves your specific challenges.
- See ManWinWin’s core features, tailored to your needs.
- Gain best practices from the world’s most experienced CMMS company, specific for your success.
- Discover your ideal ManWinWin license, investment, and timing of implementation.
2. How deferred maintenance compounds into structural cost
Deferred maintenance is rarely a decision made in isolation. It’s the outcome of competing priorities, budget constraints, and — critically — the absence of data that would make the long-term cost visible. The problem is that deferred maintenance doesn’t simply delay cost. It multiplies it.
The 1:5:200 rule is well-established in asset management: for every €1 not spent on preventive maintenance, the corrective repair costs approximately €5, and if the failure results in production impact or safety incident, the total consequence cost can reach €200. These ratios vary by industry and asset criticality, but the directional logic is consistent across sectors.
Four mechanisms through which deferred maintenance becomes exponential cost
1. Cascading component failure
When a primary component — say, a drive belt or coupling — is not replaced at its recommended interval, the resulting operational imbalance transfers stress to adjacent components. A worn coupling transmits shock loads to shaft bearings. Those bearings, now operating beyond design load, heat up and begin to score their housings. A €40 coupling replacement becomes a €2,000 bearing and housing overhaul. In rotating machinery trains, this cascade can propagate through multiple components in a single failure event.
2. Statutory compliance exposure
Pressure vessels, lifting equipment, fire suppression systems, and electrical installations operate under mandatory inspection and maintenance regimes. Deferred maintenance on these assets doesn’t just create technical risk — it creates legal liability. In most jurisdictions, a fatality or serious incident traced to a missed statutory inspection carries both regulatory penalties and potential personal liability for the maintenance manager and plant director. The cost of compliance is always lower than the cost of non-compliance.
3. Reactive maintenance premium
Emergency repairs carry a cost premium that rarely appears in maintenance budget analyses. Parts sourced outside normal procurement channels — on short lead times, from non-preferred suppliers — typically cost 20–40% more than planned procurement. Labour for emergency breakdowns, particularly if it involves overtime or contractor call-out rates, adds a further 50–100% to the baseline labour cost. And if the equipment requires specialist expertise that isn’t on-site, mobilisation time and travel further inflate the figure.
4. Production loss quantification
This is the cost that finance understands but maintenance teams often fail to articulate clearly. An unplanned stoppage on a production line with an output value of €10,000/hour means that a 4-hour emergency repair — including diagnostic time, parts sourcing, and the repair itself — has a total cost exposure of €40,000-plus, even if the direct maintenance cost is only €3,000. Presenting deferred maintenance decisions in terms of risk-adjusted production loss reframes the conversation entirely.
Key data point: A 2023 analysis by Senseye Predictive Maintenance (referenced at senseye.io/resources) estimated that unplanned downtime costs industrial manufacturers an average of $129,000 per hour. Even at 10% of that figure, the economics of preventive maintenance are unambiguous.

3. MTBF erosion: recognising the degradation curve before it costs you
Mean Time Between Failures (MTBF) is one of the most useful — and most misused — metrics in maintenance management. Properly applied, it’s not just a historical statistic. It’s a leading indicator of where your asset population is heading.
When MTBF starts declining across an equipment class — pumps, compressors, motors — it signals that the fleet has entered accelerated degradation. The usual causes are predictable: average asset age is increasing, maintenance intervals haven’t been adjusted to reflect actual operating conditions, or the original OEM maintenance specifications were designed for nominal load conditions your plant hasn’t operated at in years.
- Tracking MTBF trends by asset class is the baseline requirement. A CMMS that records every failure event against asset ID, failure mode, and date makes this trivial. Without that data structure, you’re estimating — and estimates in maintenance management almost always err on the optimistic side.
- Condition-based adjustment of maintenance intervals is the practical response to declining MTBF. If your centrifugal pumps on abrasive slurry duty are failing at 60% of their designed MTBF, the maintenance interval needs to be compressed to match. This isn’t a sign of failure — it’s how reliability-centred maintenance (RCM) is supposed to work. OEM intervals are starting points, not fixed parameters.
- P-F interval management is the technical framework for converting condition monitoring data into maintenance decisions. The P-F interval is the time between the point where a potential failure becomes detectable (P) and the point of functional failure (F). For vibration-detectable bearing faults, the P-F interval might be 2–6 weeks. For corrosion-related failures in static equipment, it could be 12–24 months. The maintenance program should be structured to inspect within the P-F interval — which means knowing what the P-F interval is for each failure mode on each critical asset.
- The bathtub curve and its practical limits: The classical reliability bathtub curve — high early failure rate, stable midlife, increasing end-of-life failure rate — describes the aggregate behaviour of a population, not individual assets. Individual assets can remain in the stable midlife phase well beyond their nominal design life if properly maintained, or enter the wear-out phase early if misused or poorly maintained. Treating design life as a hard expiry date leads to unnecessary capital expenditure on replacement assets. Treating it as irrelevant leads to running assets into failure. The answer is condition-based life extension, grounded in inspection data.
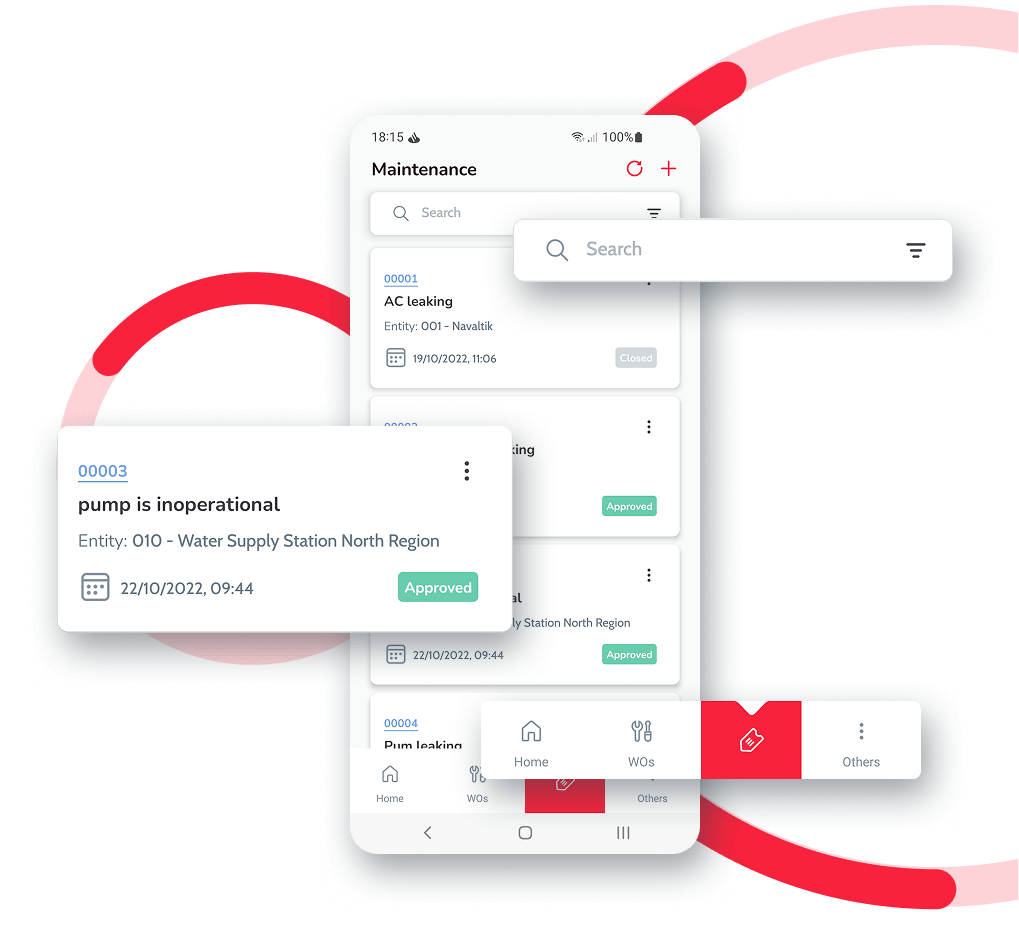
Join ManWinWin Software, the world’s most experienced company in CMMS!
Choose a better way to manage your Maintenance
Watch or book a Demo
Watch a recorded demo or get to know ManWinWin guided by one of our experts.
Use ManWinWin free version
Free forever industrial maintenance management software up to 100 Assets. Start today!
4. Frequently asked questions about aging equipment and maintenance costs
Answers that maintenance managers actually need
dummy
1. What is the average cost increase of running aging industrial equipment versus new assets?
Operating costs for aging industrial equipment typically run 25–40% higher than equivalent modern assets, when factoring in increased maintenance frequency, higher energy consumption due to efficiency degradation, and the cost of unplanned downtime events. The exact figure depends heavily on maintenance program maturity — a well-maintained 15-year-old asset can outperform a poorly maintained 5-year-old one on total cost of ownership.
2. How do I calculate whether deferred maintenance is actually saving money?
It rarely is. The correct calculation compares the cost of the deferred task (with its associated risk premium for failure probability over the deferral period) against the expected cost of the failure it prevents — multiplied by failure probability. In most cases, even low-probability failures on critical assets produce expected costs that dwarf the deferred maintenance cost. A simple risk matrix in your CMMS work order system can make this calculation visible for every deferred job.
3. What is the P-F interval and why does it matter for aging assets?
The P-F (Potential Failure to Functional Failure) interval is the time window between when a failure becomes detectable through inspection or monitoring and when it becomes a functional failure. For aging assets, P-F intervals typically shorten — meaning the window to detect and intervene before failure narrows. Maintenance programs on aging fleets need more frequent condition monitoring checks, not less, to catch failures within the available intervention window.
4. How does a CMMS help manage the hidden costs of aging infrastructure?
A CMMS provides the data infrastructure to make aging asset costs visible and manageable. It tracks failure history by asset and failure mode, calculates MTBF trends, flags assets with increasing failure frequency, manages preventive maintenance schedules, and generates cost data per asset that makes the business case for replacement or life extension. Without this data structure, decisions on aging assets are made on instinct — which systematically underestimates long-term cost.
5. At what point does it make more sense to replace an asset than to maintain it?
The decision framework is Total Cost of Ownership (TCO) comparison: the projected cost of maintaining the existing asset (preventive maintenance, expected corrective repairs, energy costs, production loss risk) over a defined horizon versus the capital cost plus operating cost of a replacement. When the maintenance cost trajectory of the existing asset exceeds the annualised replacement cost within a 3–5 year horizon, the economic case for replacement is generally clear. MTBF trend data from a CMMS is the key input for projecting future maintenance costs accurately.
6. Which industries are most exposed to hidden costs from aging infrastructure?
Process industries (chemicals, oil and gas, food and beverage) carry the highest exposure due to the combination of high asset criticality, regulatory compliance requirements, and the production loss cost of unplanned downtime. Water and wastewater utilities face similar dynamics, with the additional challenge of geographically distributed assets and limited condition monitoring coverage. Manufacturing environments with high-throughput production lines — automotive, packaging, electronics — are acutely sensitive to unplanned downtime costs, where even a 30-minute stoppage on a high-volume line produces a significant production loss event.
Discover ManWinWin services in maintenance management consulting

Implementation
The implementation consultancy is the component that turns a good software into a good solution.
Training
Training is the component that consolidates and sustains the solution on the client.
Conclusion: Stopping the bleed, structured asset management as the practical answer
The pattern described throughout this article is consistent across industries and geographies: aging infrastructure fails sooner and costs more than it should, not because equipment age is inevitable, but because the maintenance systems behind the equipment aren’t structured to manage degradation systematically.
The core requirements aren’t exotic. They are: a complete asset register with criticality classification, preventive maintenance schedules aligned to actual operating conditions (not generic OEM defaults), failure data captured in a way that enables MTBF trending, and condition monitoring coverage on assets where the P-F interval is short enough to warrant it. These are foundational practices — but they require a data infrastructure to implement consistently at scale.
ManWinWin is a CMMS platform built for exactly this operational context. Positioned between lightweight SaaS tools that lack the depth for serious industrial maintenance management and heavy enterprise EAM suites that require six-figure implementation projects, ManWinWin provides the structured asset management framework that maintenance teams in industrial and multi-site environments actually need. Asset registers, work order management, PM scheduling, failure mode tracking, cost-per-asset reporting, and KPI dashboards — including MTBF, MTTR, and OEE inputs — are core to the platform, not optional add-ons.
For organisations managing aging infrastructure where the cost of unplanned downtime is material, the question isn’t whether a CMMS is worth the investment. It’s whether the current state — reactive maintenance, incomplete asset data, and decisions made without trending information — is sustainable. The numbers in this article suggest it isn’t.
Ready to take your maintenance to the next level?
Trusted in over 120 countries – join the global maintenance movement with ManWinWin Software














About the Author
José Fernandes is the Managing Partner at ManWinWin Software (Navaltik Management), leading company in maintenance management consultancy and CMMS (Computerized Maintenance Management System) solutions.
With a technical background in industrial organization, José Fernandes has been with Navaltik since the 1990s, progressing from consultant to strategic leader and a key figure in the development of the ManWinWin software.
Throughout his career, he has overseen hundreds of maintenance system implementations across more than 30 countries, including regions in Africa, Australia, the Middle East, and East Asia.

